Ontario Roofing
HomeCasesOntario Roofing
Featured Case Study

Ontario RoofingThe Art of
Lead Generation

A story of transformation through data-driven advertising strategy.

+26%
Conversions
Year over Year
-32%
Cost Per Lead
Reduction
85+
Qualified Leads
Generated
2,359%
ROAS
Return on Ad Spend

An Ontario roofing company came to us. They promoted roofing and siding services in a limited geographic area. The niche was highly competitive and strongly seasonal. During winter, demand dropped significantly, and weak ad setup made the problem worse.

Our goal was not just to improve Google Ads metrics, but to build a system where decisions could be made based on qualified leads, closed sales, and revenue.

In the end, we cleaned up the account, achieved strong advertising profitability, and built a transparent connection between ads, qualified leads, sales, and revenue. For every $6 in marketing spend, the business generated about $100 in revenue.

"We went from guessing to knowing exactly where every dollar was going and what it was bringing back."
— Project Lead, Ontario Roofing

What We Changed

First, we rebuilt the account.

Campaigns were segmented by service lines so each one could be managed separately. We tightened traffic control, used phrase match, and applied aggressive negative keyword management to filter out junk queries and reduce irrelevant inquiries.

We also launched a separate competitor campaign. This let us evaluate whether that segment could generate quality conversions and capture demand from users already comparing contractors.

Most importantly, we built a system that allowed the business to scale based on real numbers, not assumptions.

End-to-End Analytics and Qualified Leads

The key shift was moving to end-to-end analytics.

We connected advertising to the CRM and started optimizing not for raw leads, but for qualified leads. This let us see which campaigns produced not only volume, but also quality.
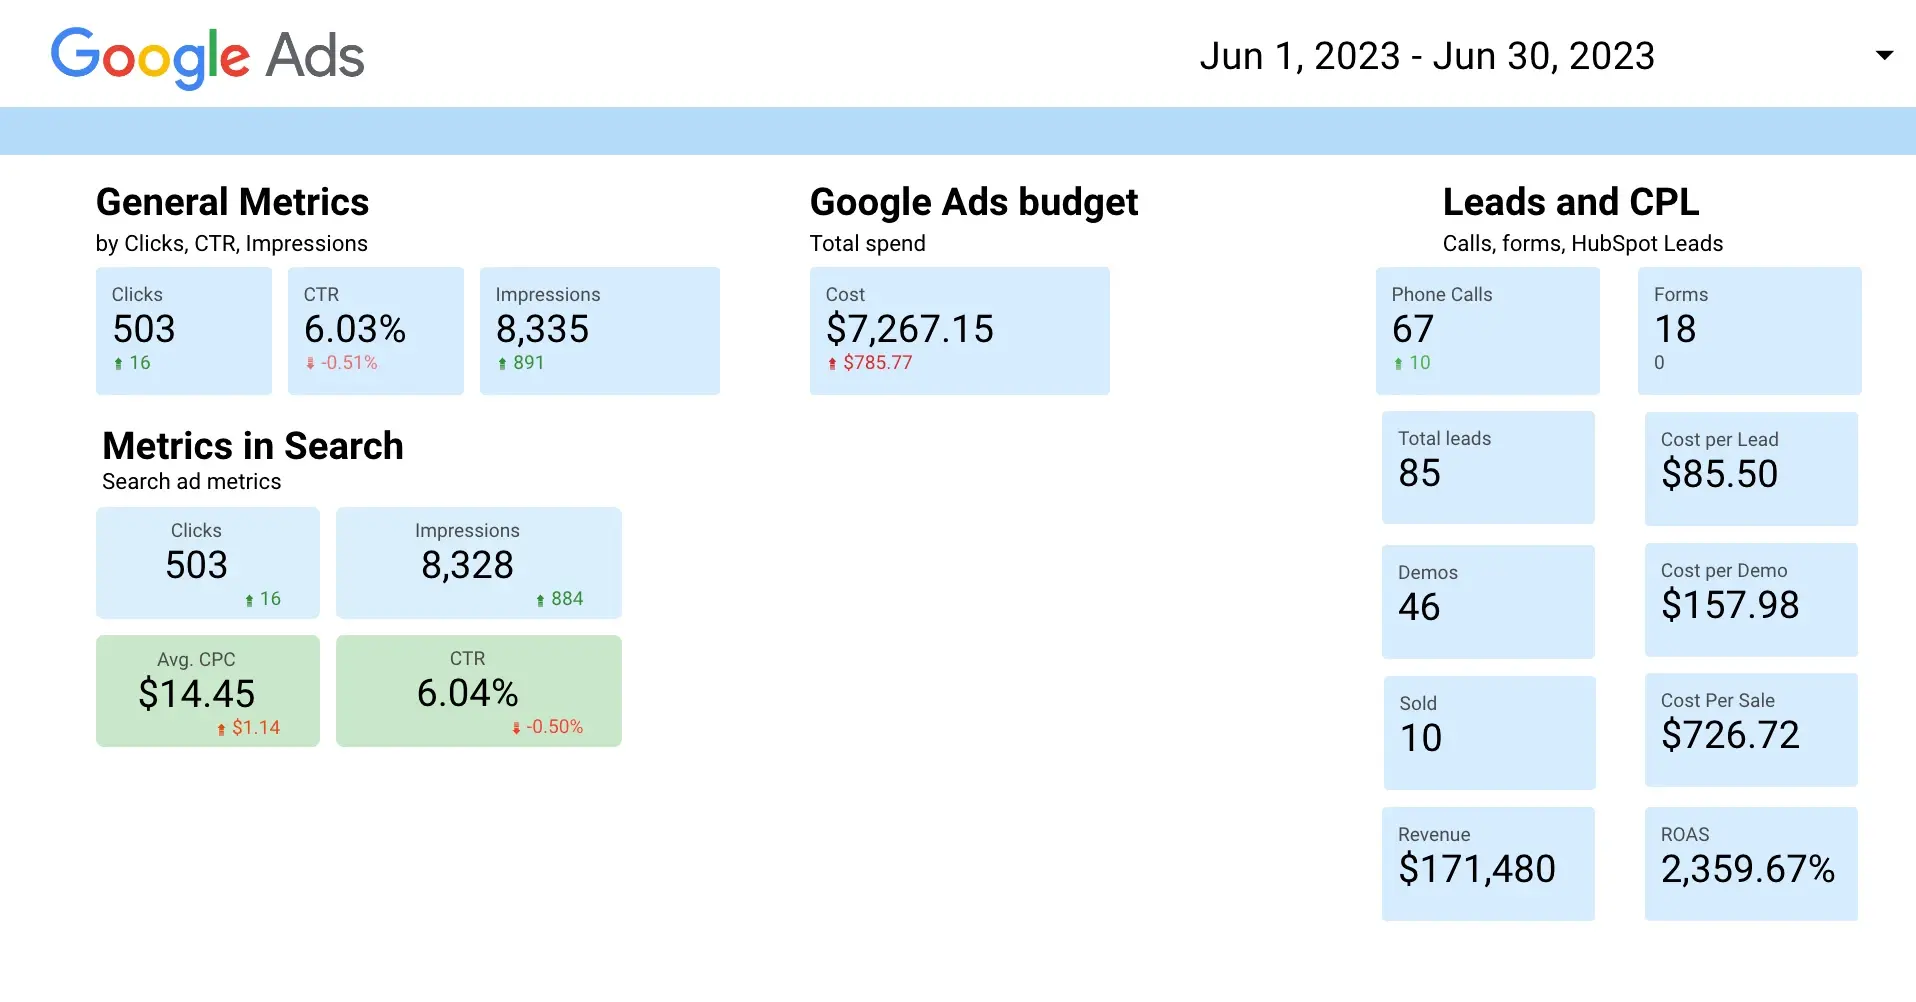
Client dashboard with key performance metrics
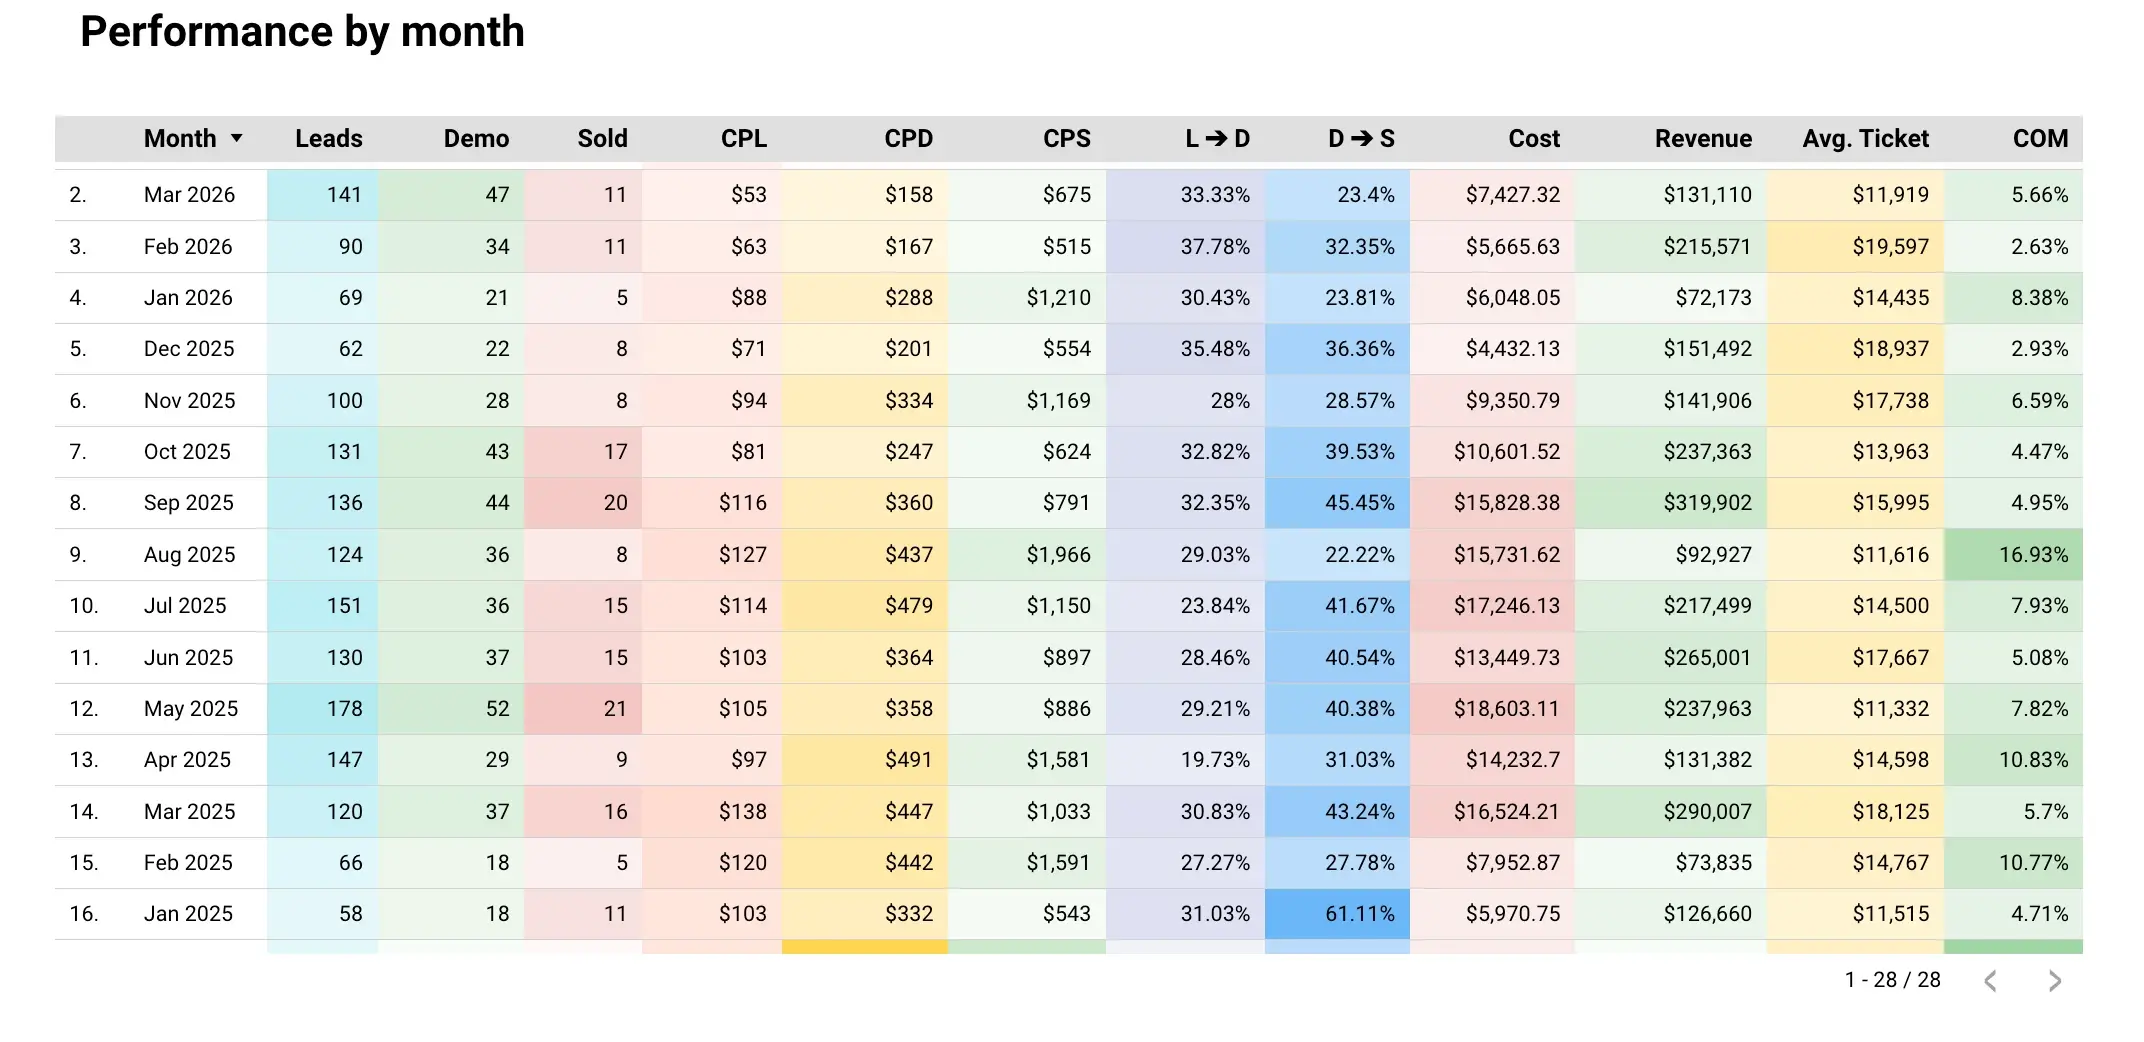
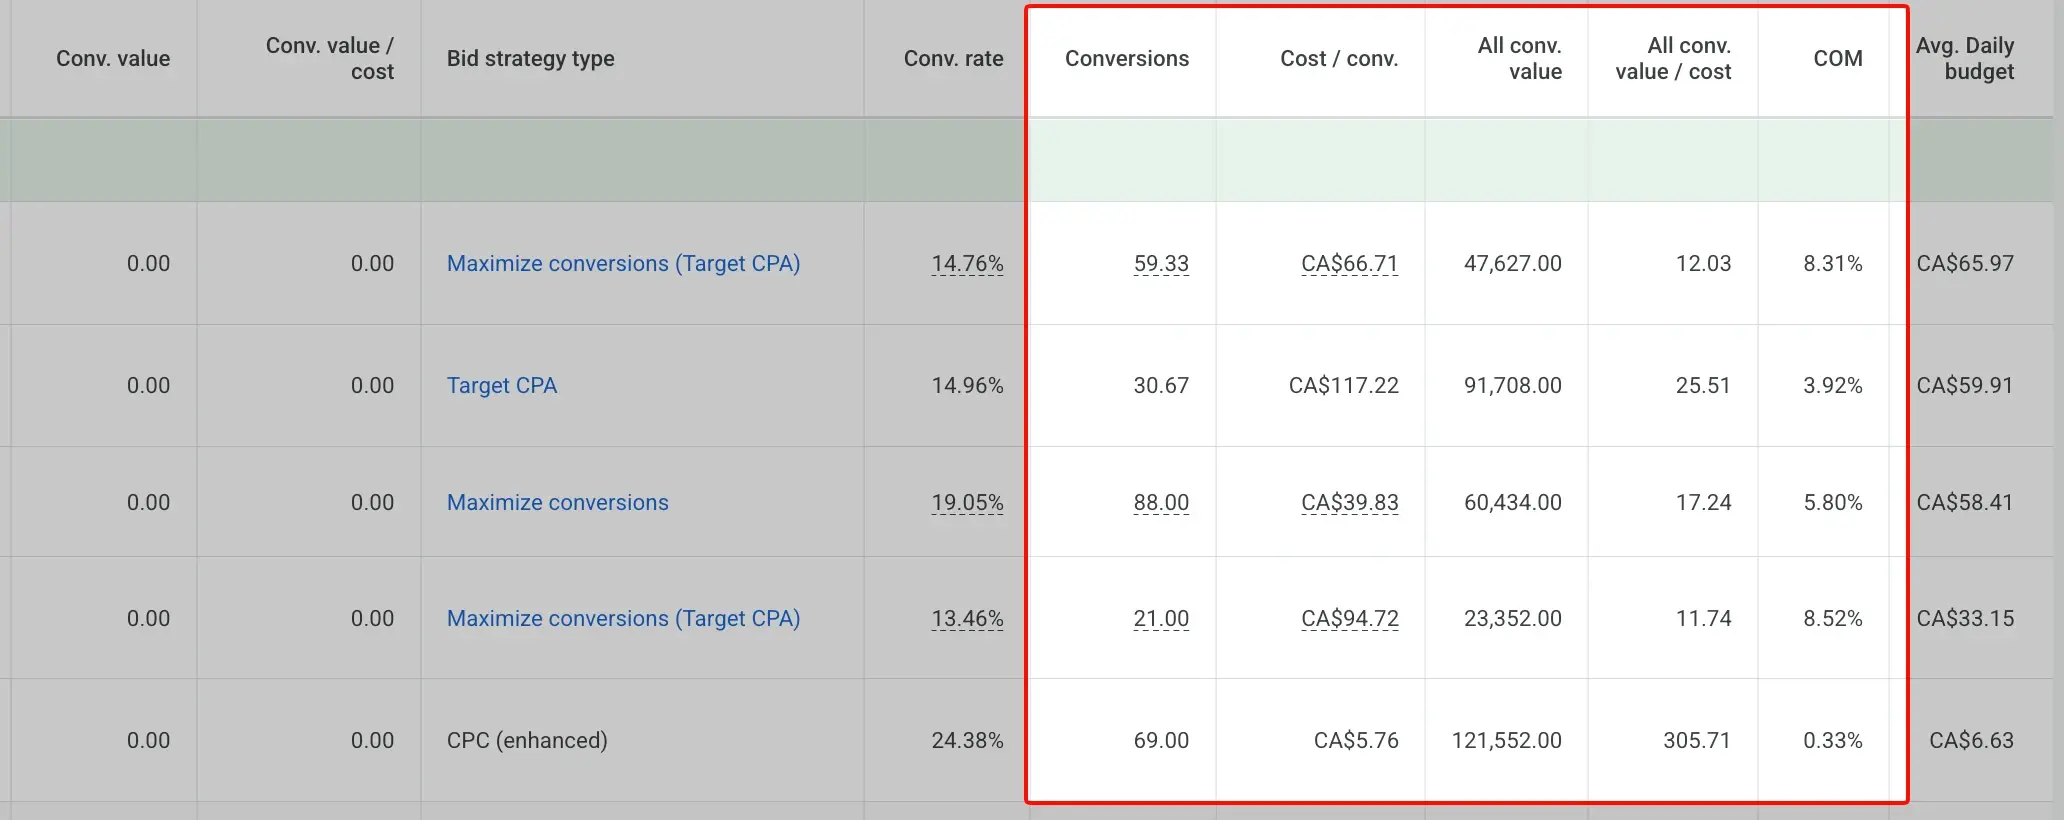
Offline conversion report and keyword-level performance

Every metric is under control, both in the Google Ads account and in the client dashboard.

After that, we went further and set up offline conversions. Sales data started flowing back into the ad platform at the campaign and keyword levels.

As a result, we could clearly see:

  • the cost of every keyword;
  • the revenue generated by every keyword;
  • which campaigns actually paid off;
  • where average order value was higher;
  • what share of revenue was being spent on marketing.
Dedicated Landing Pages

Dedicated landing pages for Google Ads traffic became an important part of the strategy.

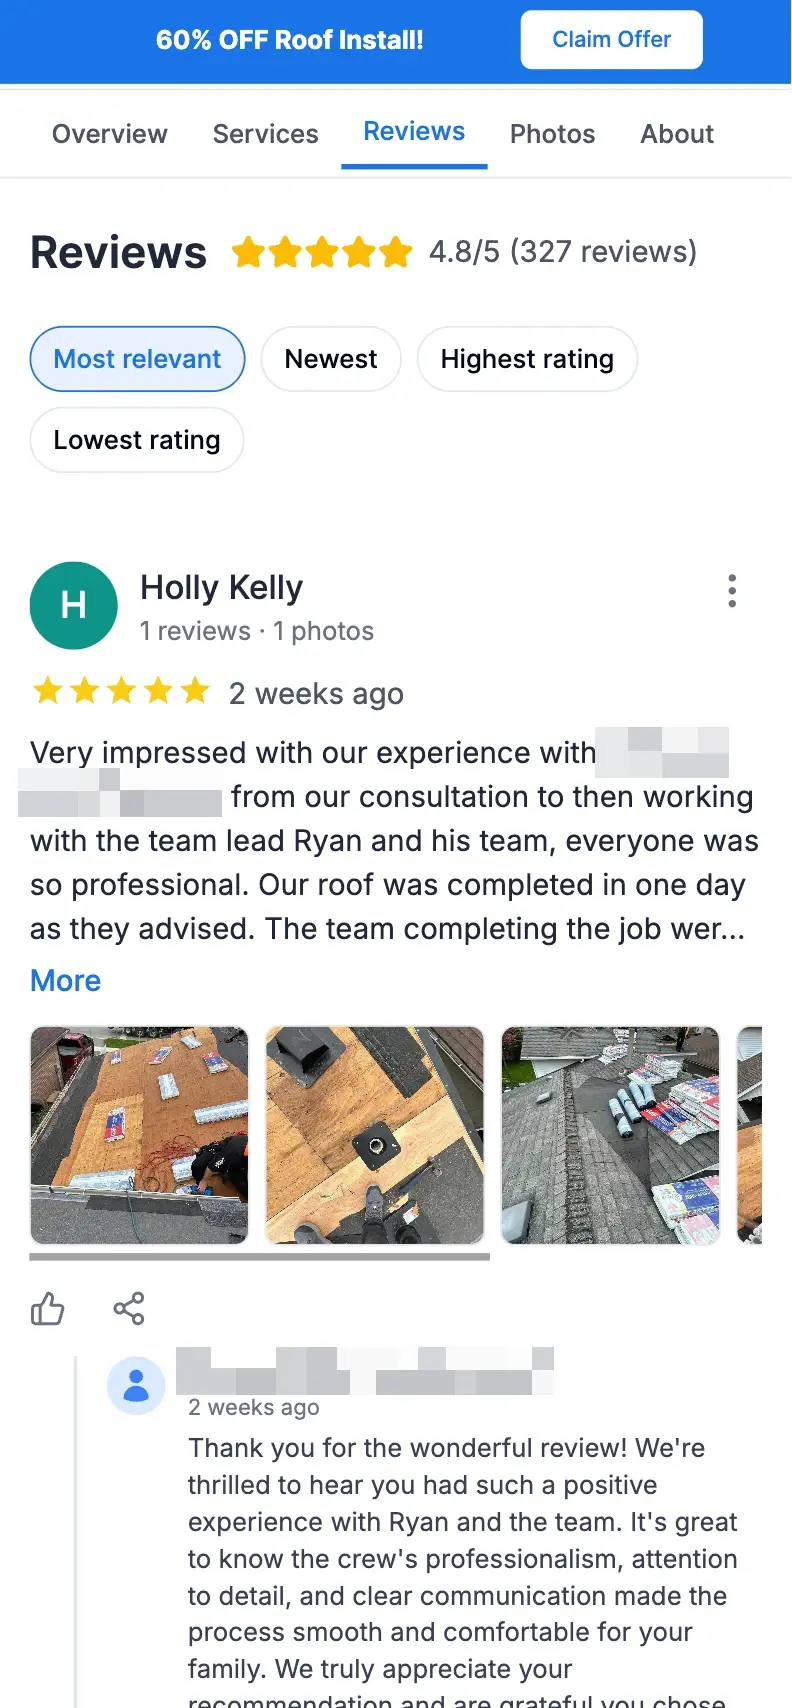
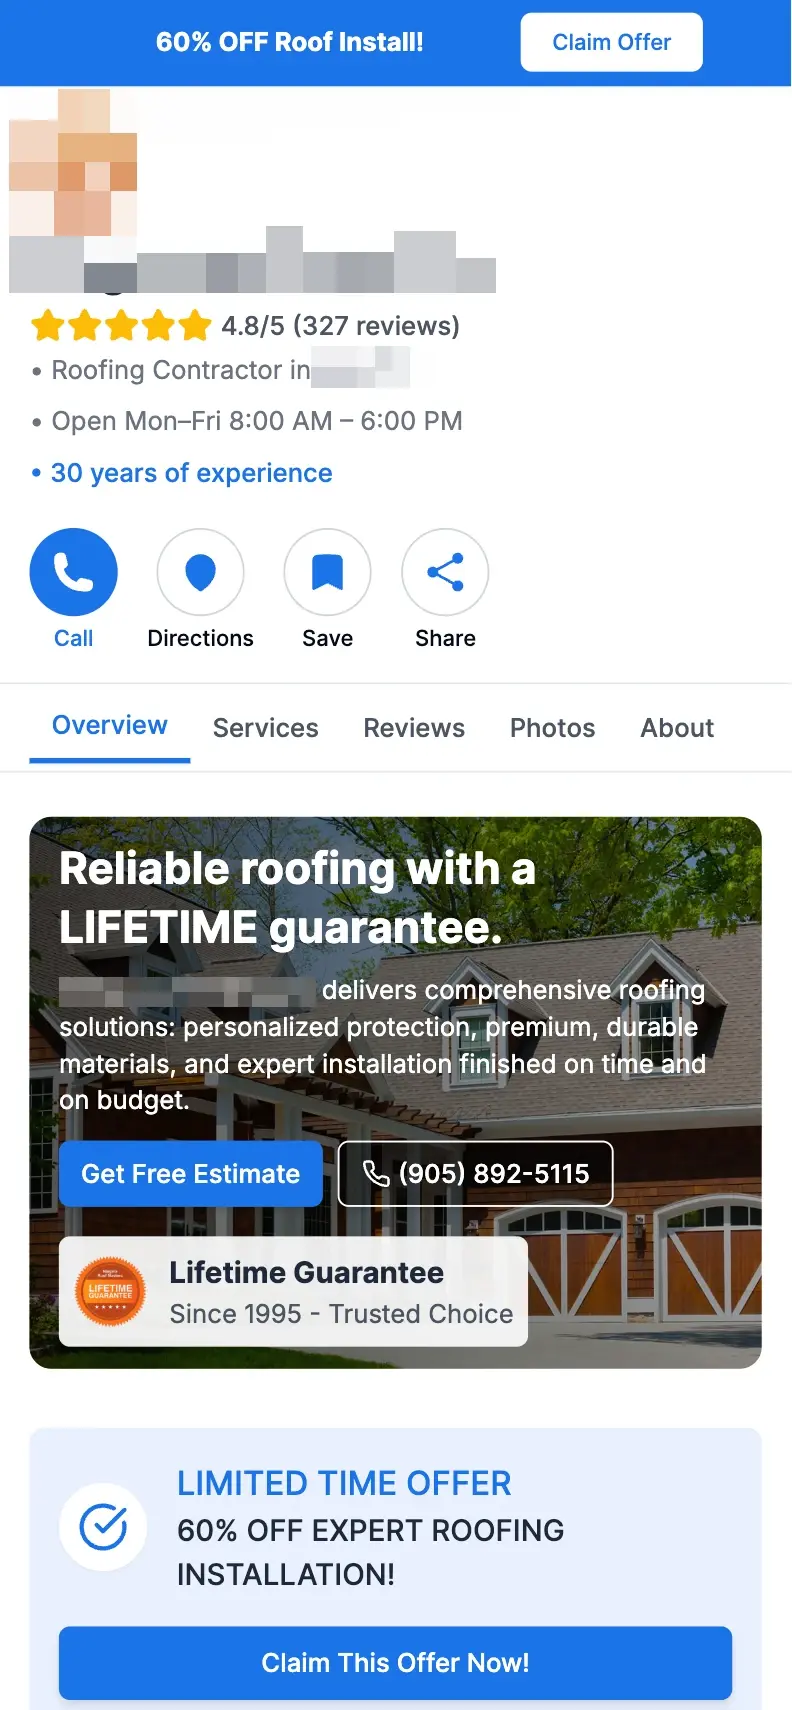
We did not send users to their standard website. Instead, we built dedicated pages visually and structurally similar to a Google My Business profile (Google Maps). On mobile, the experience felt familiar: users saw ratings, reviews, photos, the offer, a call button, address, business hours, guarantees, and other elements people usually expect when choosing a local contractor.

Google My Business-style landing page, version 1
Google My Business-style landing page, version 2

Tests showed that this landing page outperformed the client's main website.

This did not mislead users. On the contrary, it helped them orient faster and increased initial trust. People landed in a familiar visual environment, saw real reviews, a clear offer, and key company benefits in a format they already understood.

This approach delivered high conversion rates, because the page not only captured leads, but also built trust before the first contact with the company.

Results

After rebuilding the account, improving structure, tightening traffic filtering, and shifting optimization toward qualified leads and closed sales, the project moved onto a much stronger growth path.

Performance Dashboard
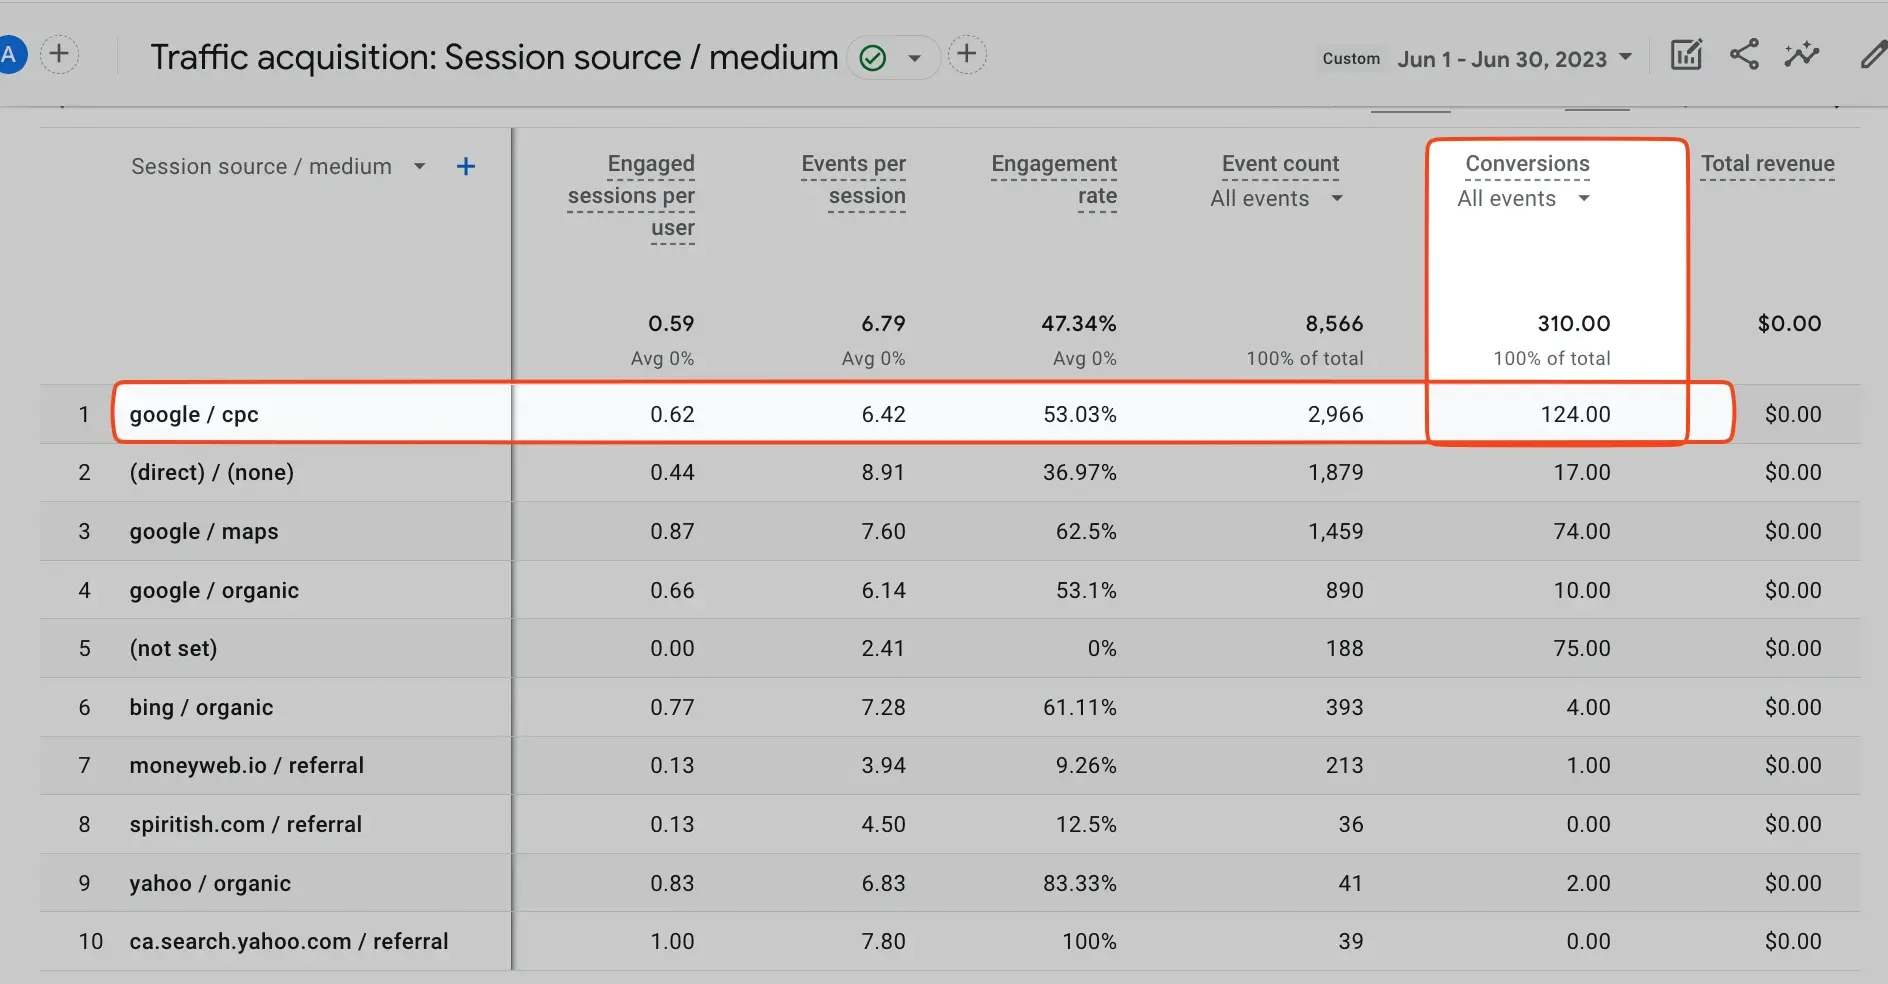
Analytics Report

These screenshots show dashboard and analytics views that help track the full monthly and campaign-level picture.

+26%
year-over-year growth in conversions
-32%
lower cost per lead
85+
qualified leads per month
2,359%
return on ad spend
6%

We also reached approximately a 6% marketing spend share of revenue. This means ad costs represented a relatively small portion of the revenue generated by the channel.

Your business is capable of more. Shall we check?

An expert look from the outside often saves thousands of dollars. It's free.

Free audit includes competitor analysis, campaign optimization recommendations, and growth roadmap